Great Project Solutions  ·  Proprietary Intelligence

OPUS
Project
Intelligence

Our comprehensive proprietary database of megaproject activity across North America and Europe — tracking 399 active projects, over $2.26 trillion in total investment cost, and the full delivery landscape across sectors, phases, and regions.

Total Projects
399
Continuously updated
Tracked TIC
$2.26Tr
Continuously updated
Total Contractors
over144
In the OPUS database
Assignments
over317
Contractor–project links
Proprietary Intelligence Platform

The Data Engine Behind Our Intelligence

over
$2.07Tr
Total investment tracked across 332 projects in the active delivery period Sep 2026 – Dec 2032

OPUS is Great Project Solutions' proprietary project intelligence database — built and maintained to track the most significant capital projects across North America and Europe by location, sector, phase, total installed cost, and owner. It is the analytical foundation of every market intelligence engagement we undertake.

Where public data is fragmented, delayed, or aggregated beyond usefulness, OPUS provides a project-by-project picture that enables genuine modelling of construction demand. It is built to answer the questions that matter to an Owner making a procurement decision: who is building in my region right now, what trades are they competing for, when will demand peak, and how should procurement be timed to secure the right supply chain before the window closes.

OPUS data has the potential to be a powerful decision-making tool for Owners, contractors, and investors alike. It can surface risks — contractor market concentration, equipment lead time pressure, labour shortages in specific trades — before they become problems. And it can surface opportunities: windows of lower competitive demand, emerging contractor capacity, or regional markets where the supply chain is better positioned to deliver. We are actively exploring how best to make that intelligence available beyond our own advisory engagements.

Every project in OPUS is cross-referenced across primary and secondary sources and updated continuously as announcements, financial disclosures, and construction progress reports are published. The result is a living dataset that reflects the market as it is today, not as it was twelve months ago.

What OPUS Tracks

Project Intelligence Across Every Dimension That Matters

Project Location & Geography

Every project is mapped to its precise location — enabling regional demand analysis, labour market clustering, and logistics assessment at the county and metro level, not just the national level.

Total Installed Cost (TIC)

Project-level TIC data — tracked and cross-referenced — allows genuine comparison of capital commitment across sectors and geographies, powering quantitative demand modelling for any market.

Construction Phase & Status

OPUS distinguishes between Planning, Under Construction, Complete, Commissioning, and Cancelled — giving clients a real-time picture of when demand will hit the market, not just the total pipeline.

Owners, Contractors & Assignments

OPUS tracks 144 contractors and 317 contractor–project assignments, mapping who is building what and where — enabling clients to understand contractor capacity, concentration, and competitive availability.

The OPUS Dashboard

Visualising the Megaproject Landscape

The OPUS dashboard translates project-by-project data into clear, actionable visuals — a sector spend profile and an interactive map of every tracked project, updated continuously as new projects are announced and existing projects progress through delivery.

TIC Spend Profile · Stacked by Sector 332 projects · $2.07Tr in period
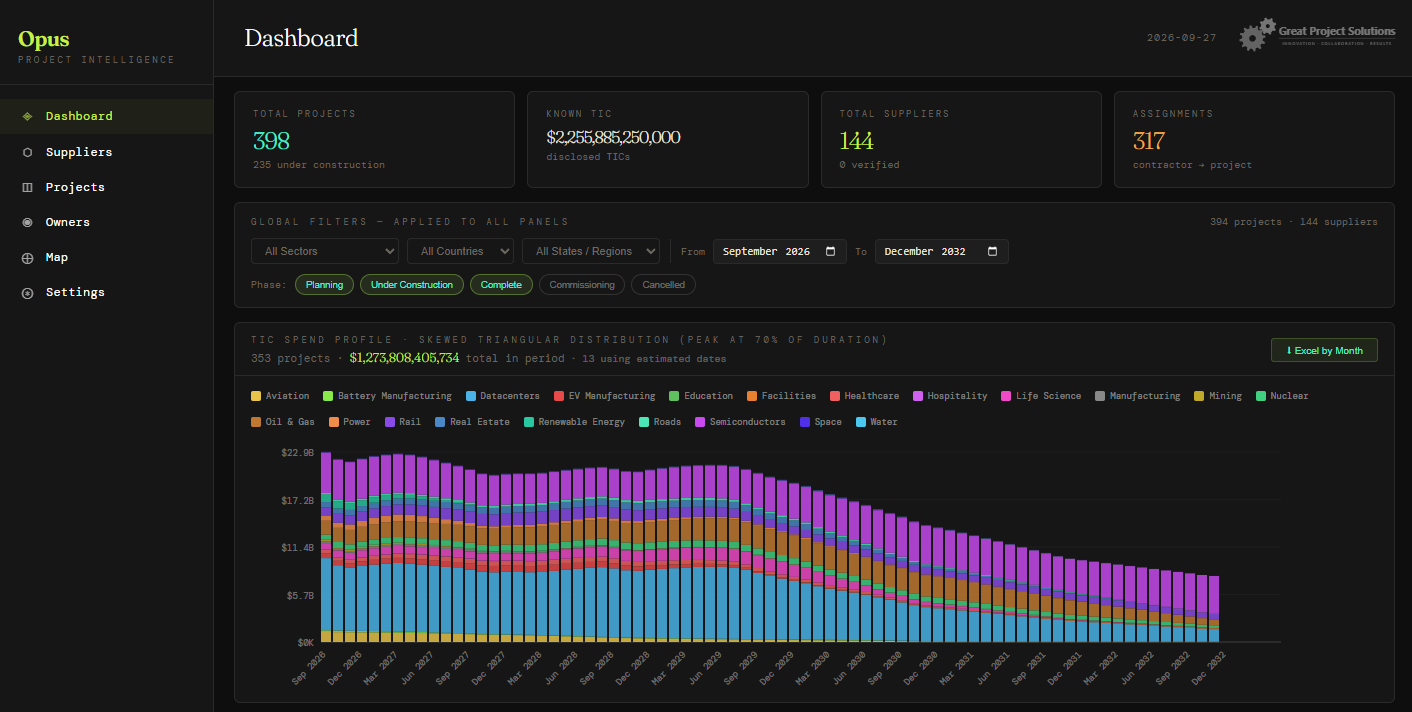
OPUS Dashboard showing TIC spend profile by sector from September 2026 to December 2032, peaking at approximately $22.9B per month
Monthly TIC spend profile across 332 tracked projects, modelled using a skewed triangular distribution peaking at 70% of each project's duration. Colour-coded by sector across 20 categories including Datacenters, Semiconductors, EV Manufacturing, Rail, Life Science, and Oil & Gas. Peak spend of approximately $22.9B per month occurs in late 2027 / early 2028.
Project Map · US Active Projects 399 projects mapped
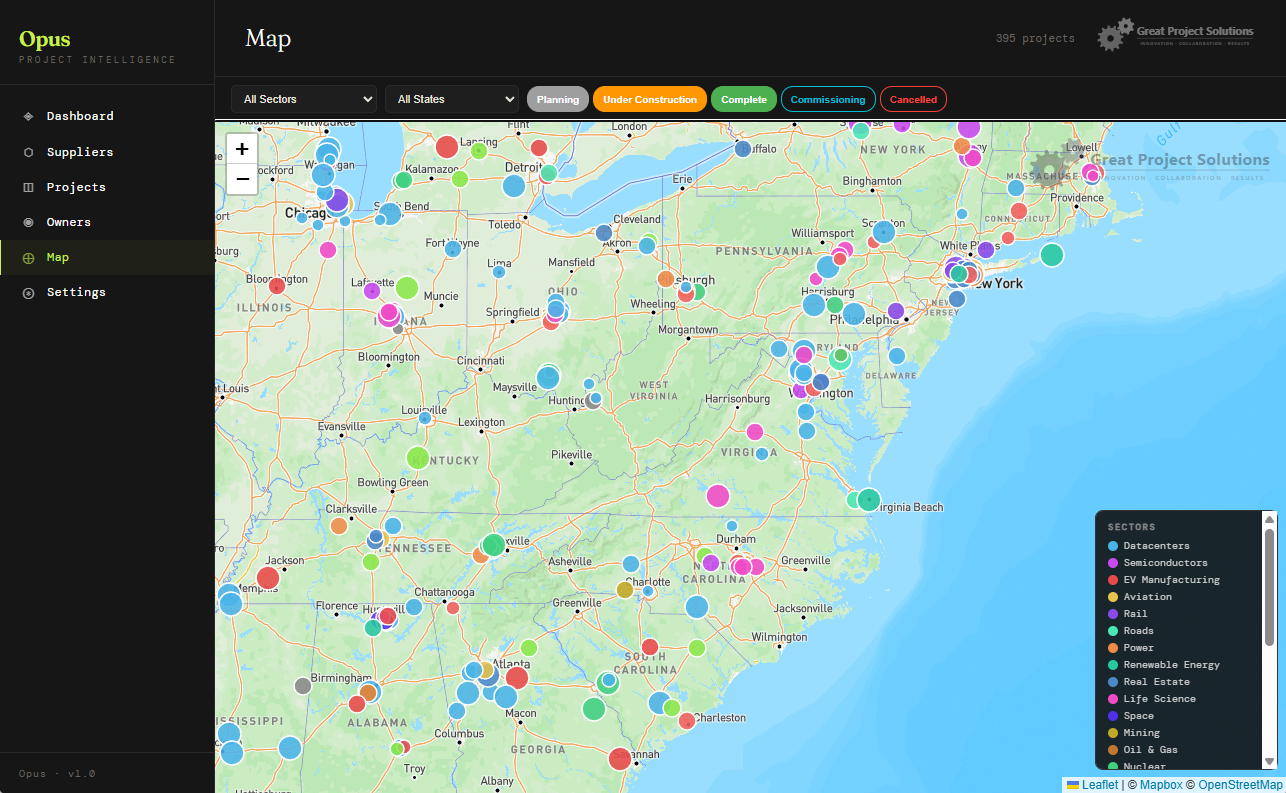
OPUS interactive map showing 399 active megaprojects across the United States, colour-coded by sector
Interactive Example

Explore 36 projects within 100 miles of New York City — filter by sector, state & phase.

Full tab
Interactive map view of active megaprojects across the United States, colour-coded by sector. Each marker represents a tracked project with full TIC, phase, owner, and contractor data available on click. Filter by sector, state, and phase to isolate demand in any region or market segment. Try the live New York City example
OPUS in Action

Published Intelligence Powered by OPUS Data

OPUS underpins our published market analysis — translating project-by-project data into the kind of intelligence that informs procurement strategy, supply chain planning, and capital deployment decisions across North America and Europe.

The $1.3 Trillion Supercycle: How AI Is Overwhelming the Construction Supply Chain
Read article
Is Your Supply Chain Ready to Cope with the Disruption of COVID-19?
Read article
Coping with the Consequences of COVID-19: Avoiding Financial Failures in the Supply Chain
Read article
Talk to Us About OPUS

Want to Know What the Data Says About Your Market?

OPUS underpins the market intelligence we bring to every advisory engagement. If you are planning a major capital project across North America or Europe and want to understand the competitive landscape, supply chain pressures, and demand timing in your region, we would welcome a conversation about how our intelligence could inform your decisions.

Get in touch